MindManager's spreadsheet feature provides a method for including topic-specific numeric data. It uses a standard interface similar to other spreadsheets you have used, and provides basic spreadsheet functions and the ability to display the data as a chart.
The spreadsheet can be sized and displayed or hidden. The data can be shown in spreadsheet form (a data table) or, in chart form (graphical representation).
If you already have data entered in Excel, you can link to the Excel data.
Select
the topic(s). On the Insert
tab, in the More Topic Elements
group, click Spreadsheet.
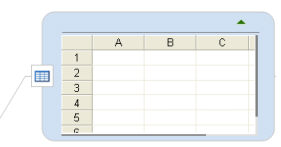
An empty spreadsheet will appear on the topic(s).
Right-click the topic's Spreadsheet
icon  , then click Edit Spreadsheet
Select the topic then double-click on the spreadsheet.
Once the edit mode is started you'll see a toolbar with buttons for the spreadsheet commands, and OK or Cancel options for ending the edit mode. In edit mode you can type in the data, or paste it from another application.
You can paste data from another spreadsheet, or from a document that has data values separated by tabs.
To see more rows or columns select the spreadsheet and enlarge it by dragging the bottom or right margins.
Once the data is entered, you can go on to rearrange and format it to
suit your needs. The spreadsheet functions are based on standard spreadsheet
conventions so they will be familiar to you. 
To further customize the spreadsheet, you can set the spreadsheet properties.
Right-click on the topic's spreadsheet icon and click Spreadsheet Properties.
After you've entered and formatted the spreadsheet data you can choose to display only the data, or, if you prefer to show a graphical representation of that data, you can create a chart.
Optional If you are not already in spreadsheet edit mode do one of the following:
Right-click
the topic's Spreadsheet icon and click Edit
Spreadsheet.
Select the topic then double-click the spreadsheet.
Click
Chart View  .
.
To select the chart's data range enter the range limits, or click and drag to select the data, then press Enter.
You'll
see a default chart displayed. Click Chart
Properties  to customize the chart to your liking. Some options
can be set directly using the Chart toolbar buttons, or, right-click the
chart ,and then click Properties for
the full set of options.
to customize the chart to your liking. Some options
can be set directly using the Chart toolbar buttons, or, right-click the
chart ,and then click Properties for
the full set of options.
Optional If you are not already in spreadsheet edit mode do one of the following:
Right-click
the topic's Spreadsheet icon , and then click Edit Spreadsheet
Select the topic then double-click the spreadsheet.
Choose the view to display:
Click the spreadsheet toolbar's Chart View
button to see the chart.
Click the spreadsheet toolbar's Spreadsheet View button to see the spreadsheet.
Click
the topic's show or
hide
or
hide  button.
Right-click
the Spreadsheet topic icon ![]() , then click Remove
Spreadsheet from Topic.
, then click Remove
Spreadsheet from Topic.
![]()