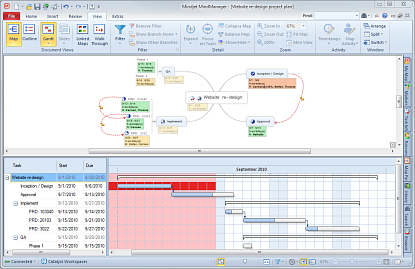
Gantt View displays tasks on your map as a task list and a Gantt chart. You can add, remove, an change some Task Info directly in this view. A task must have a Start Date and Due Date to appear in the Gantt chart.
See Print for more information on printing your map as a Gantt chart.
What do you want to do?
A Gantt chart shows your tasks in a timeline view.
On the View tab Document Views group, click Gantt.
To choose the Gantt View position, click the Gantt arrow, and then choose a position.
The Gantt chart will display tasks that have a Start date and a Due date.
To include tasks on your chart whose task info is calculated by task rollup click the Gantt button, and enable Show Intermediate Topics in Gantt Chart.
|
Non-work days are shaded on the chart. These are defined in the Map Calendar. |
|
If you enable the Show Overutilized Weeks in Gantt Chart option (on the Gantt button pull-down menu) weeks with Overutilized resources are indicated by special shading on the Gantt chart. |
|
Dependencies are also shown here.
|
Use the splitter between the task list and the Gantt chart to adjust the view of the list and chart.
To zoom in and out (decrease or increase the displayed range of dates) do one of the following:
Use the Gantt slider on the status bar. ![]()
Click the Gantt chart background, and then press CTRL as you use the scrollwheel on the mouse.
To fit the Gantt chart to the window click the
Fit Gantt Chart button ![]() on the status bar.
on the status bar.
To see a different range of dates, use the scrollbar at the bottom of the chart, or drag the date bar at the top of the chart left or right.
You can expand or collapse tasks in the list or in the chart:
In the list, click ![]() to expand
a task, or click
to expand
a task, or click ![]() to collapse
a task.
to collapse
a task.
On the chart, right-click a task and then click Expand Task, or Collapse Task.
Right-click on a task in the task list or on the chart, and then click:
New Topic to add a task at the same level
New Subtopic to add a sub-task of the current task
Delete Topic to remove the task from the Gantt Chart and from the map.
You can change some Task Info directly in Gantt View.
Edit any item in the task list to change it. The corresponding map topic will reflect the change.
Drag the Gantt bar for the topic in the chart to change it's Start and Due date.
Drag the left or right end of the Gantt bar to change its Start or Due date, and increase or decrease the task's duration.
You can add dependencies in Gantt view.