Use Analysis
Views |
What do you want to do? |
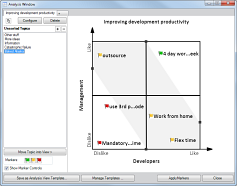
Analysis Views can help you make better decisions by prioritizing
and categorizing your mapped topics. This feature allows you to
display topics of your choosing on a customizable 2x2 analytic
chart, and position them to reflect their relative rankings using
the chart's axes values as criteria. Markers are applied to the
topics based on their chart positions.
Using this qualitative, visual method (as opposed to a method
based solely on numerical data) allows you to evaluate information
and ideas using criteria that are not easily quantified. Unlike
standard “table generation” products, an Analysis View allows
you to dynamically add, remove, and move topics on the chart to
reflect your evaluation based on these criteria.
 Read
Hint Read
Hint
You can create multiple Analysis Views on a map, and these Views
can use any map topics you choose. That is, a topic on the map
may appear in one, several, or no Analysis Views. This offers
you a variety of ways to evaluate distinct or overlapping sets
of topics using different criteria.
The Views you create are automatically saved with the map, and
you can create a template from any view to use its settings again
on another map. You can also copy any View as a graphic that you
can paste into your map or another document to demonstrate your
decision-making process.
|
|
Create a new
View
When you create a new Analysis View, you select the topics to use in
the View, configure the View's parameters, and then position the topics
in the View to reflect their rankings. Markers that indicate these rankings
are automatically added to the topics in the View based on their positions.
Once you are finished with your analysis, you can apply the markers shown
in the View to the topics on your map.
Select topics to include in the View.
Select the topics you want
to include on your map. See Select
topics and objects for hints on how to select multiple topics.
These can be from various locations on your map
(they do not all need to be from a single branch) and can include floating
topics and callouts. You can add or remove topics from the View later,
so you are not "locked into" using only the topics that you
add now.
On the Advanced
tab, click the Analysis arrow,
then click New.
When the Analysis Window
appears, you’ll see a tab for the new View with the topics you selected
in the Unsorted Topics list.
If this map already has other Analysis Views defined,
they will each display a tab in the Analysis Window.
Configure the view
In the Analysis Window, at the top of the tab for the new View, click
Configure to set the View's parameters:
View Name
– Enter the name for the View. This will be displayed as the View's title.
View Template
– Select a template to use its pre-defined configuration settings. You
can customize these at will for this View.
View Type
– Determines how the axes are configured. 2-Axis and Segmented views allow
either quadrant or subjective groupings defined by bands. (Bands divide
the chart diagonally into 3 regions used for applying markers, in contrast
to the quadrant view with 4 regions.)
Axis Labels
or Quadrant Labels – Define the
criteria you use for ranking your ideas, and the directions of arrows
on 2-Axis Views.
Markers
– Select the markers that will be applied to topics based on their positions
in the View. You can choose from any of the markers that are in the current
map’s marker list. If your View Type can use bands, you can choose Bands and select 3 markers (assigned
from lower-left to upper-right), or select Quadrants
and select 4 markers.
When you are satisfied with the View's configuration settings, click
Done. You can modify these settings
again at any time to fine-tune your View by clicking Configure
again.
Position topics in the View
Once you have set the initial configuration options, you can move topics
from the Unsorted Topics list into the View and then position them to
reflect their ranking. You do not have to include all the Unsorted Topics
in the View.
To move topics into or out of the View:
Select one or more topics
in the Unsorted Topics list, and then click Move
Topic into View.
Select a topic in the View,
and then press Delete.
To rank topics:
If you have configured your chart to use Bands to define regions for
applying markers, you can adjust their position on the View to fine-tune
the subjective grouping of your topics. As you adjust them, the topic
markers will change to reflect this grouping.
To adjust Bands:
Apply the View markers to the map
To apply the markers you see in the Analysis View to the topics on your
map:
Click Apply
Markers to Map below the View.
If you continue to adjust
the topic positions in the View, or if you change the markers used
by the View configuration, the markers on your map will be updated
automatically.
Modify
or remove an existing View
Once you have created an Analysis View, you can modify it by adding
more topics to it from the map. You can open the View to further configure
it by adding, editing, or removing topics directly in the Analysis Window,
or by changing the configuration settings.
Add more map topics to the View
On your map, select the
topics you want to add to the View.
On the ribbon's Advanced
tab, click the Analysis arrow, then click Add
and select a view from the list of existing views.
The topics are added to the Unsorted Topics list
for the View. You can add them to the View, position them, and then apply
the markers from the View to the map topics.
Open an existing Analysis View
To open the View:
The View will open in the Analysis Window.
To switch to another View:
Add, edit, or remove topics used in the View
To add a new topic to the list of unsorted topics:
To edit a topic in the Unsorted Topics list or in the View:
To remove a topic from the View, move it back to the Unsorted Topics
list:
To remove topics from the Unsorted Topics list:
Change the View Configuration
You can change the configuration settings used by a view at any time.
In the Analysis Window,
select the View, and click Configure.
You can select a different
template, or modify the configuration settings manually. If you select
a new template or change the View Type, you will be asked whether
you want to keep the current topic positions on the View, or discard
them.
If
you keep the positions, the topics remain in the view where you placed
them.
If
you discard the positions, all topics in the View are moved back into
the Unsorted Topics list.
Click Done.
The view will be updated to show the new configuration settings.
Remove an Analysis View from the map
When you remove an Analysis View from a map, only the view is removed.
The map topics and any markers that have already been applied from the
view are not affected.
Save
and manage Analysis View templates
You can save the configuration settings from any View you have created
as a template for re-use on other maps. In addition, you can modify any
of the standard templates or the templates that you have created, create
a new template from scratch, and delete templates.
Save a template
To save the current View configuration settings as a template:
A new template will be created with the current configuration settings.
This template will be available on any map, each time you create a new
Analysis View or modify an existing View.
Edit a template
To edit an existing template:
In the Analysis window click
Manage Templates.
In the Manage Templates
dialog, select the template you want to change.
At the bottom of the
dialog, click  .
.
Modify the information in
the Configuration dialog, and then click Done.
Delete a template
When you delete a template it is deleted from disk, and is no longer
available for use on any map.
To delete a template:
In the Analysis Window,
click Manage Templates.
In the Manage Templates
dialog, select the template you want to remove and then click  .
.
Copy
the Analysis View chart
Once you have conducted your analysis, you may want to show how it was
conducted. You can copy any Analysis View chart as a graphic that you
can paste into your map or another document to demonstrate your decision-making
process.
To copy the chart as an image:
The image of the chart is copied to the Clipboard.
You can paste the image into your map or into another document.
 Read Note
 .
.