New features in this version include: |
|
Share all of the information captured in your maps with your extended team using Mindjet Connect, Basic edition. The Mindjet Connect Basic edition makes it easy for you to try out Mindjet Connect's collaboration features. You can store maps and files online, and then share these with other people. When you're ready, you can purchase a Mindjet Connect Business edition account to get more features and storage.
The Mindjet Connect features are enabled in MindManager automatically
as soon as you sign in. Just click ![]() on the bottom
status bar and enter your Mindjet ID (create one first if you don't already
have one). You'll get immediate access to Mindjet Connect features in
the Mindjet Connect window.
on the bottom
status bar and enter your Mindjet ID (create one first if you don't already
have one). You'll get immediate access to Mindjet Connect features in
the Mindjet Connect window.
Learn more: What is Mindjet Connect?
 Guided Brainstorming
The new Brainstorm feature provides a three-step guided process to help you create a new map. Just click the Brainstorm button on the Home tab to see the Brainstorm task pane. Then use the step-by-step process to create your map.
 |
Step 1: Identify the current challenge.MindManager provides a set of predefined challenges to choose from or you can create your own custom challenge. Stuck? MindManager provides challenge cards to help you identify and refine the problem that you're trying to solve. Step 2: Generate ideas.Quickly capture and add ideas into your map. Stuck? MindManager's idea inspiration cards provide provocative questions and key words to help unleash your best ideas. Step 3: Categorize and Refine.Use predefined or customized branches to organize your map and refine your ideas. |
Learn more: Brainstorm
 Analysis Views
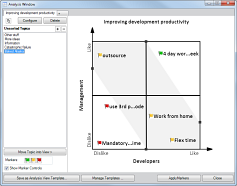
Make better decisions by prioritizing and categorizing your mapped topics using Analysis Views. This new tool allows you to drag and drop topics into a predefined series of 2x2 analytic charts. Standard charts include Cost vs. Opportunity, Urgent vs. Important, SWOT, and others. You can customize the chart axes with your own terms and save them as templates for future use. Unlike standard “table generation” products (like Microsoft Excel) which are typically based on quantitative data, the Analysis Views allow you to dynamically Add, remove, and move topics on the chart to allow you to easily create a 2X2 chart that reflects your qualitative feedback. The resulting chart can also be exported as an image. |
 |
Learn more: Use Analysis Views
 Marker Index
 The Marker Index pane displays a pivot view that shows your map topics categorized by their markers, providing a fast and easy way to see and navigate to your map's important content.
Click the Marker Index button on the Home tab to see the Marker Index task pane.

Click any topic in the pane to immediately select the topic in the map (especially useful for navigating in large maps).
Enable or disable marker indexing, configure which markers to track, and copy the indexed list to the clipboard using the controls at the top of the pane.
Learn more: Use the Marker Index
 Multiple Hyperlinks on Topics
You can now add multiple hyperlinks to a single topic, similar to including multiple attachments on a topic. This lets you track more information in less space.
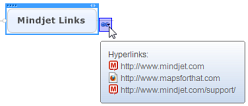
Add multiple links using the Hyperlink command on the Ribbon's Insert tab, from the right-click shortcut menu, by using cut and paste, or by dragging a link inside a topic from your browser. Managing them is similar to managing attachments.
Multiple hyperlinks are exported to Word documents, Web pages, PowerPoint presentations, and by Pack and Go; they are also imported from Word documents. (Note: Project imports and exports include only single hyperlinks. When multiple hyperlinks are present, only the first link is used.)
Learn more: Hyperlinks
 CSV Spreadsheet
Export
CSV Spreadsheet
ExportExport either an entire map or a selected branch to a CSV (comma-separated-value) file which can be opened as a spreadsheet by other applications. Choose from three export layouts: Pivot, Table and Outline.
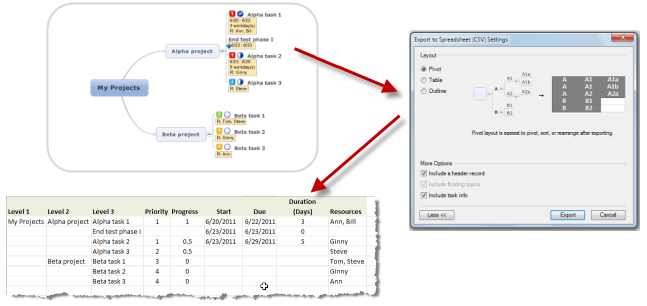
To export the entire map, click File, Export, Export to Spreadsheet (CSV).
To export only a specific branch, right-click the parent topic. In the shortcut menu, click Send To, and then click New Spreadsheet (CSV) File.
You can also customize your output by including column headers, floating topics and task information.
Learn more: Export to Spreadsheet (CSV)
 Enhanced Project
/ Task Management
Enhanced Project
/ Task Management 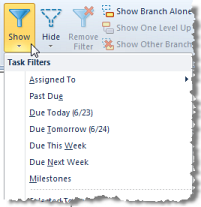 |
The filtering capability has been updated to let you quickly 'show' or 'hide' content. New Task Filters let you quickly filter your map to show task assignments, overdue tasks, upcoming tasks and task milestones with just a couple of clicks. Use the Show or Hide commands on the Ribbon's View tab to apply a filter based on task info. |
Learn more: Use instant Task Filters
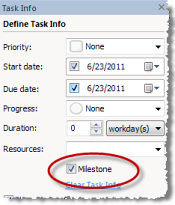
You can characterize task milestones by selecting an option in the Task Info pane. |
|
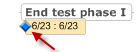
The milestone indicator will appear on the map...
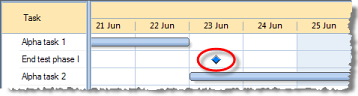
... and within the Gantt chart. |
|
Milestones are included in Microsoft Project Imports and Exports.
Learn more: Milestones
You can enable an option to display and use Effort information for tasks. You enter the Effort value in the Task Info pane... |
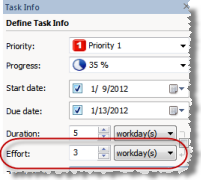 |
... and it is displayed on the map below the topic. Effort info is rolled up on Task Management branches. |
 |
Learn more: Task Info - Effort FAQ
 |
Beyond priority and progress, now you can sort branches by task information including start date, due date, duration, effort and resources. |
Learn more: Sort topics
More Task features include...
As part of the CSV export, you can export your map to a spreadsheet along with all of your important task information.
Specify the date range for the printed Gantt chart, and see a Print preview.
Drag a topic from your map onto the Gantt chart to make it a task.
Partially entered tasks will also be included in the task rollup capabilities.
 SharePoint
Integration
SharePoint
Integration
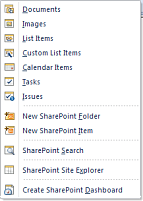 |
MindManager puts the power of SharePoint at your control to improve access to organizational assets to accelerate projects and collaborative processes. Include live links to SharePoint items in your map to create dynamic views showing you the data that matches the criteria you choose. |
 New Built-in Templates,
Online Gallery, plus Maps for That! Integration
New Built-in Templates,
Online Gallery, plus Maps for That! IntegrationWe've provided an entire new selection of templates to get you creating the kinds of maps you want to create quickly and easily.
If you don't see the template you need, check the online gallery for even more professionally-produced templates. For more ideas, link to Mindjet’s online Maps for That! gallery of maps to access and download hundreds of maps created by the Mindjet community. Once you’ve registered you can also upload your own maps, rate and add comments for others.
We've added the most common and frequently used key mapping capabilities on the Home tab letting new users get up and running faster than ever before. Experienced users will benefit from the consolidated groupings of commands in each tab.
The File menu has been simplified and improved.
A new 'getting started' pane displays when you first start MindManager. It includes video and text instructions to guide you through the basics of mapping, collaborating and sharing maps, and using templates and shortcuts, with links to additional materials online.
We've introduced a 'home page' for the MindManager browser which lets you start researching with your map content in view. The default page is set to Google but you can set it to any page you wish, using the MindManager Options.
When you find content that you want to include in your map, right-click to use commands in the shortcut menu to send text, images or the page link directly into your map.
We've added a format painter and numbering to improve the formatting of your Topic Notes.